
Did you know that lenders are required to record key points of information about all their borrowers and applicants, and report that to the federal government? And did you also know that for the past few years, the federal government has made much of that data available to the public? If you didn’t, we’ve got you covered. Read on for our summary of the HMDA data related to manufactured housing.
What is HMDA Data?
Before we dive into charts, graphs, and our analysis, we need to first define what we’re looking at. The Home Mortgage Disclosure Act (HMDA) requires mortgage lenders to keep records of certain pieces of information regarding their lending practices.
The purpose of the act is to monitor the geographic targeting of mortgage lenders, provide identification mechanisms for predatory lending, and to provide reporting information to the federal government. You may be familiar with this act, because it is responsible for the page in a credit application regarding ethnicity, race, and veteran status.
It’s also important to note that our most recent dataset is from 2018. Because of the massive task of recording and reporting this information, the previous year’s data is not typically available until fall of the following year. This means that 2019 data will be available in the fall of 2020.
You can access the data here.
Why does it matter?
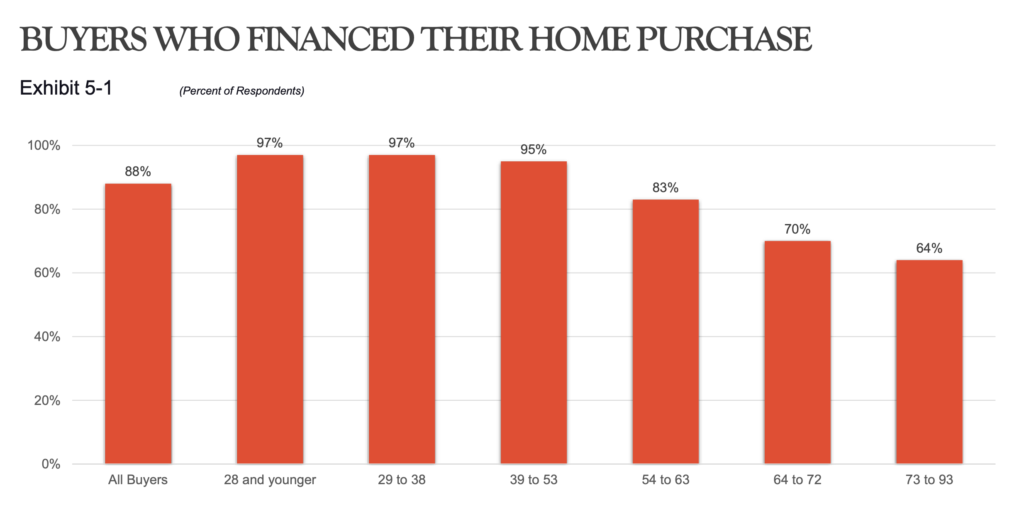
The data matters because it helps us get a more global perspective of the industry. It’s no surprise that most borrowers use financing to purchase a manufactured home, but it may be surprising just how high that percentage actually is. According to the National Association of Realtors, nearly 90% of borrowers will finance their home purchase. 96% of buyers under the age of 53 will finance their home purchase. This means that close to 90% of home sales will be captured by the HMDA data. And because the federal government regulates the reporting and false reporting would be a big “no-no”, we have very high confidence in the accuracy of the data.
It also matters because it gives us perspective of our own markets. The housing market is a constantly evolving environment, and using concrete data can help us define our customers and learn how they borrow money and purchase homes.
What does the manufactured housing borrower look like?
Let’s first start with where people are purchasing manufactured homes. Keep in mind that this data includes all manufactured home loans, not just new homes. This means that some states that receive a lot of shipments may not rank as high as other states that have lots of pre-owned inventory. For this analysis, we’re only looking at first liens.
In 2018, there were 162,788 single family manufactured home loans in the United States. The state with the most (see below) was Texas, coming in with just over 16,000. The state with the fewest was Hawaii, with a total of 7 manufactured home loans.
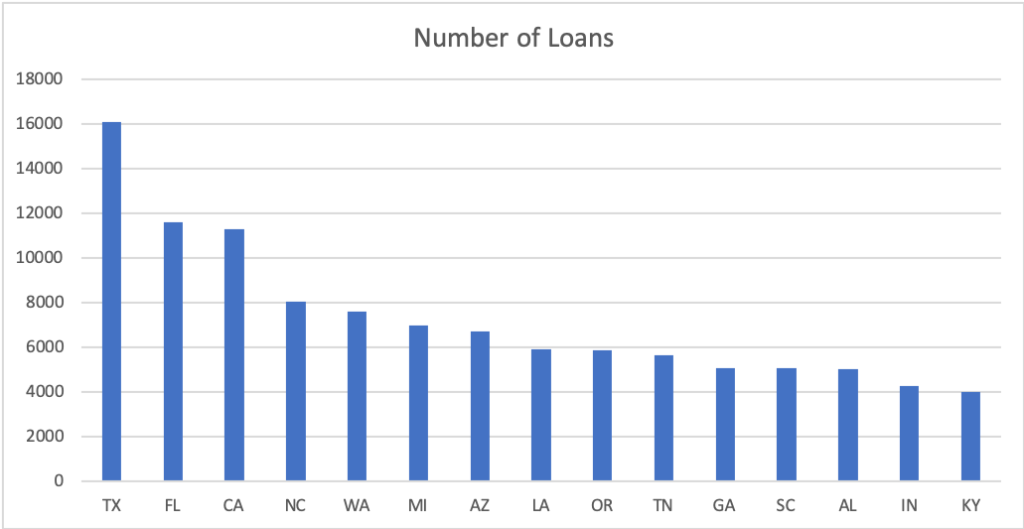
Texas is leading by a large margin, which isn’t surprising. Some of the other states in the top 15 may be a surprise, however. Remember that some of the states have a large market for pre-owned homes, typically because they have a VERY high cost of housing (California and Washington, for example).
Popular in…LA?
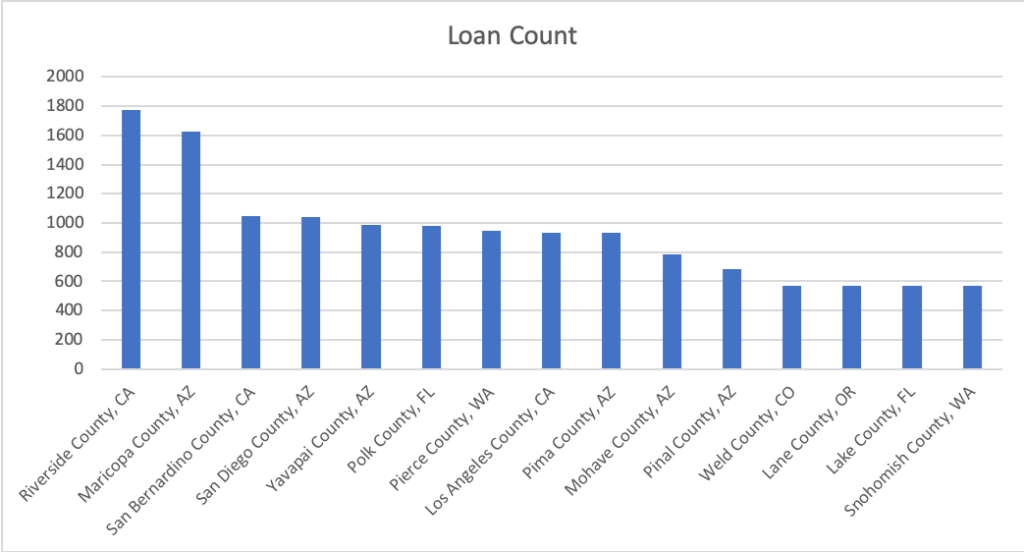
Let’s drill this down a little further though. We’ve got the popular states, so let’s look at the popular counties. (See graph below) Keep in mind that you won’t see some of the top states because manufactured housing is spread throughout the state, and in some of the examples below, manufactured housing is concentrated in one county or metro area.
That first county surprised us too – but it’s really a ‘perfect storm’ in which manufactured housing can thrive. There’s a VERY high cost of housing, combined with a growing population, and an abundance of communities. It’s hard to imagine that suburban LA is a manufactured housing mecca, but the high cost of housing, population density, and geography have created the perfect problem for manufactured housing to solve. To put it into perspective, borrowers financed more manufactured homes in Riverside County, CA than the entire state of Minnesota.
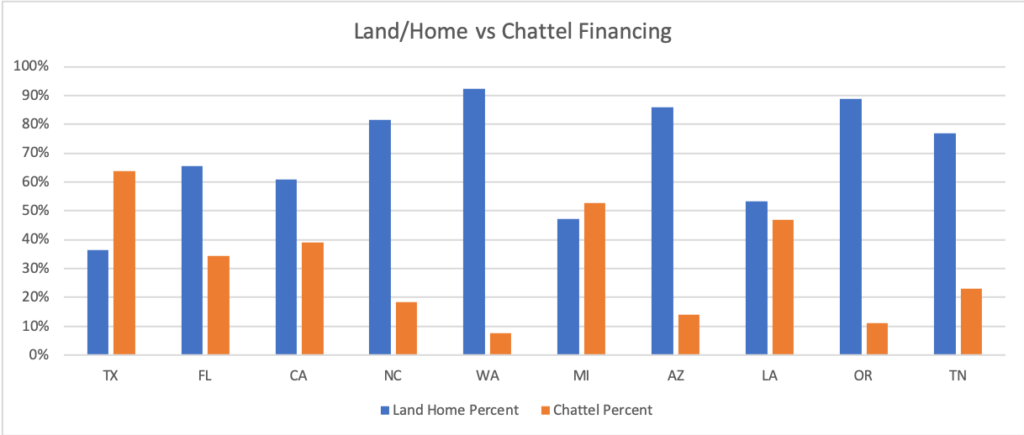
So what do those loans look like? As you can see from the graph below, chattel vs land/home loans vary greatly from state to state.
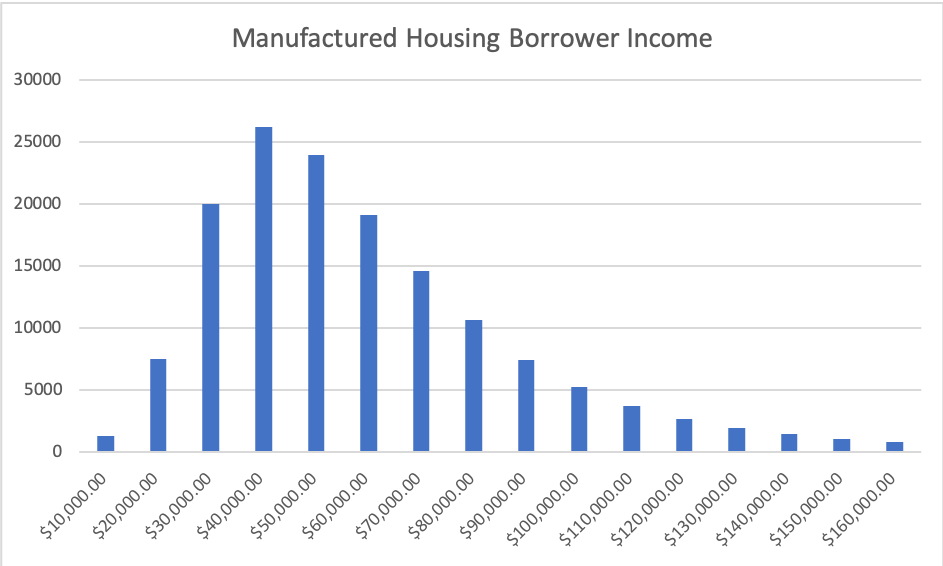
Because we’re discussing borrowing, income is going to be an important factor in this analysis. Look at the chart below to see how much annual income manufactured home customers have. We cut the chart at $160K/year.
There probably aren’t any surprises here either. The vast majority of our industry’s customer’s make between $30K and $60k, which is right around the average household income in the US. This means that the average income earner in this country is a great customer for manufactured housing.
Borrower Age
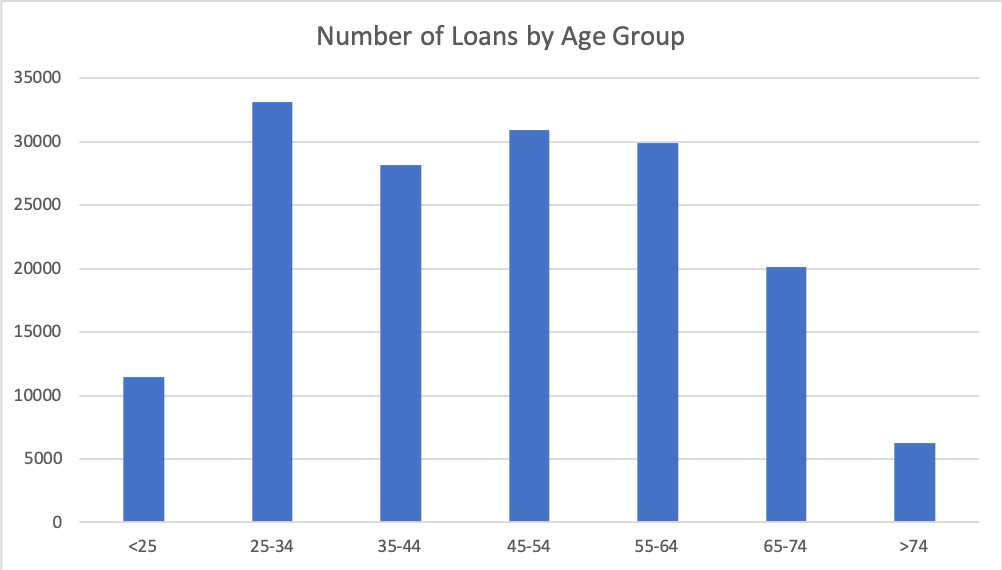
Now we know where the borrowers are, how much money they make, and what type of loan they’re getting. But how old are they?
This data actually surprised us a bit. The typical manufactured home buyer has a wide age range – buyers from age 25 all the way up to 64 are pretty even. It is important to note that the 25-34 age group is at the top, and that is the age group that is likely looking to purchase their first home.
Want some tips marketing to that younger age group? Click here to read about Facebook for the manufactured home retailer.
What about the manufactured housing lenders themselves?
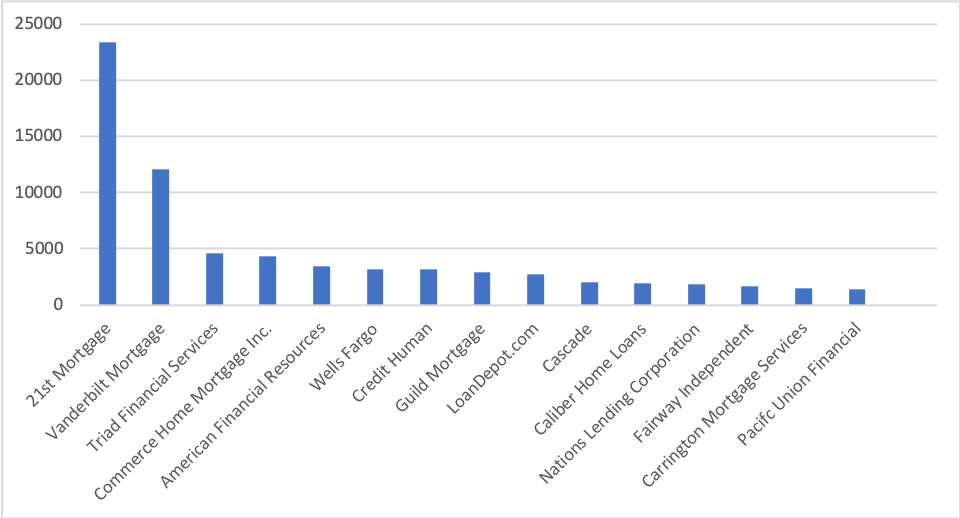
And since we’re talking about lending, we have to look to see who the largest lenders in the industry are. No one’s going to gasp in surprise at this one: 21st Mortgage and Vanderbilt Mortgage have a pretty firm grasp on the number 1 and number 2 spot. This is in terms of number of loans booked in 2018. The graph looks a little different when you look at the data in terms of total dollar volume booked, but #1 and #2 remain the same.
It’s also interesting to note that there are some lenders in the mix that are not typically associated with manufactured housing. Wells Fargo is a good example of that. As it turns out, Wells Fargo does a lot of business with realtors and listing agents selling pre-owned homes and and land/home packages.
Whew! That was a lot of bar graphs. What’s the take away? For retailers, the best take away from this is a better understanding of the broad picture of the manufactured home buyer. They’re young, they’re old, they make a lot of money, and some of them just make a little money. They live in rural Louisiana, and they live in suburban California.
And as you’re creating your marketing message to reach your buyers, keep some of these statistics in mind and make sure you include all groups that purchase manufactured homes.